Comparison chart of hierarchical LoRa testing for Flux.
1.0
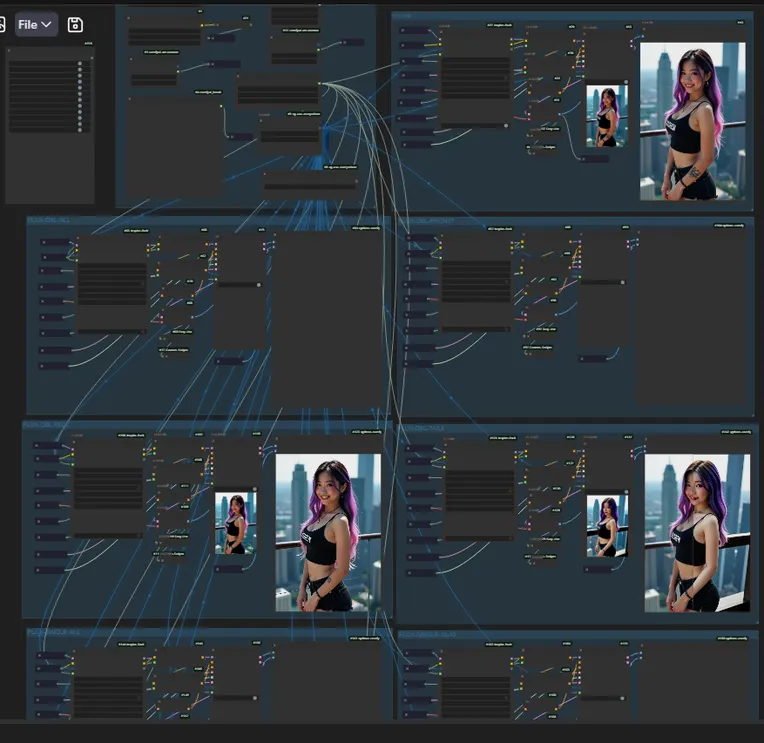
 Image info
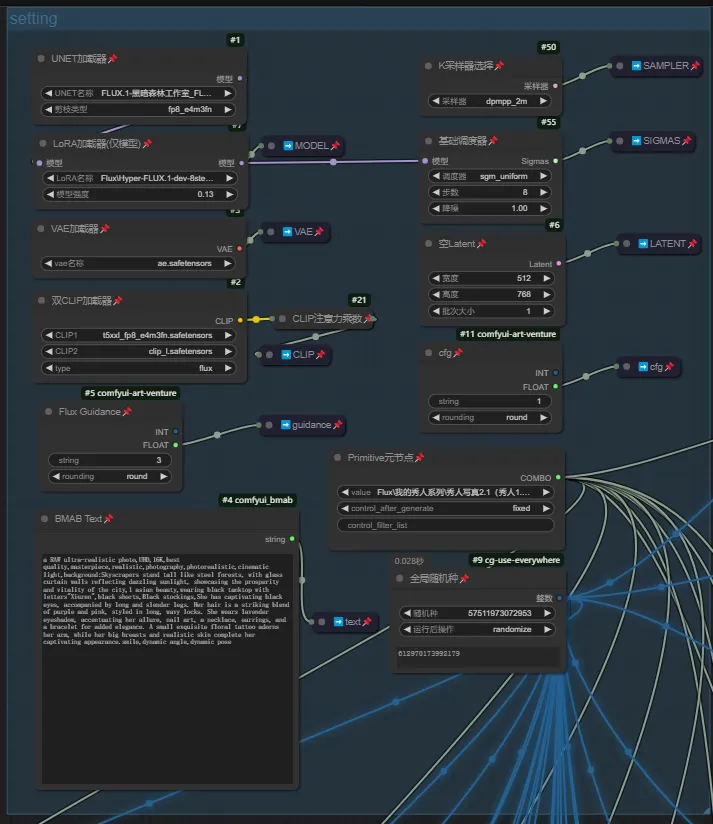 Image info
This workflow should currently be unique on the internet.
The function is to compare the effects of different layered lora parameters by loading them and running the images for testing specific layered effects. Then, layered lora (my other workflow) can be created, whether through fusion or loading and running, to achieve optimal effects and minimize pollution to the original image (such as art style or disabled limbs, etc.). Currently, I don't have much time to test it. If you have a good graphics card, you can run it a few times to roughly determine the effects of the layers.
Due to the multiple layers of flux, which can be as many as 57 layers, I did not set up individual tests for each layer but rather ran them in groups. Below are the default groups in the workflow:
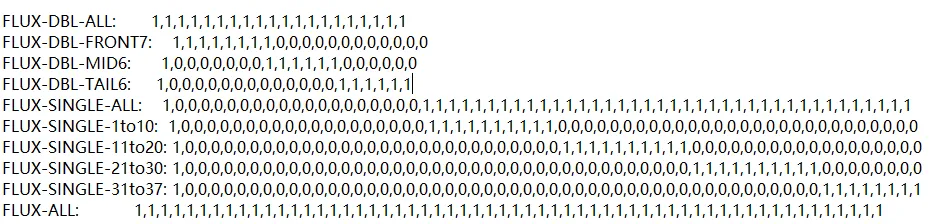
You can also manually set the parameters for each layer, all of which are already integrated into the workflow. Just copy and paste them into the lora loader.
In addition, the settings for the workflow parameters are all within the setting box. I won't say much about that. If you understand this, you won't be confused by the settings.
Currently, this comparison image running method is a bit primitive. After the efficiency loader is updated in a while, I will release another workflow for running xyz charts, which can greatly simplify the interface. For now, we have no choice but to run it this way. The efficiency loader currently does not fully support flux, which is necessary for running xy charts. The author has clearly stated that the support will be updated soon.